
the operating system for the bug lifecycle
Stop sending developers bug reports they can’t reproduce.
Bug Traker captures what happened at the point of failure — screen replay, console and network evidence, annotated screenshots — and carries the issue through triage, resolution, testing and verification.
- Web application
- Catch That Bug
- VS Code
- MCP
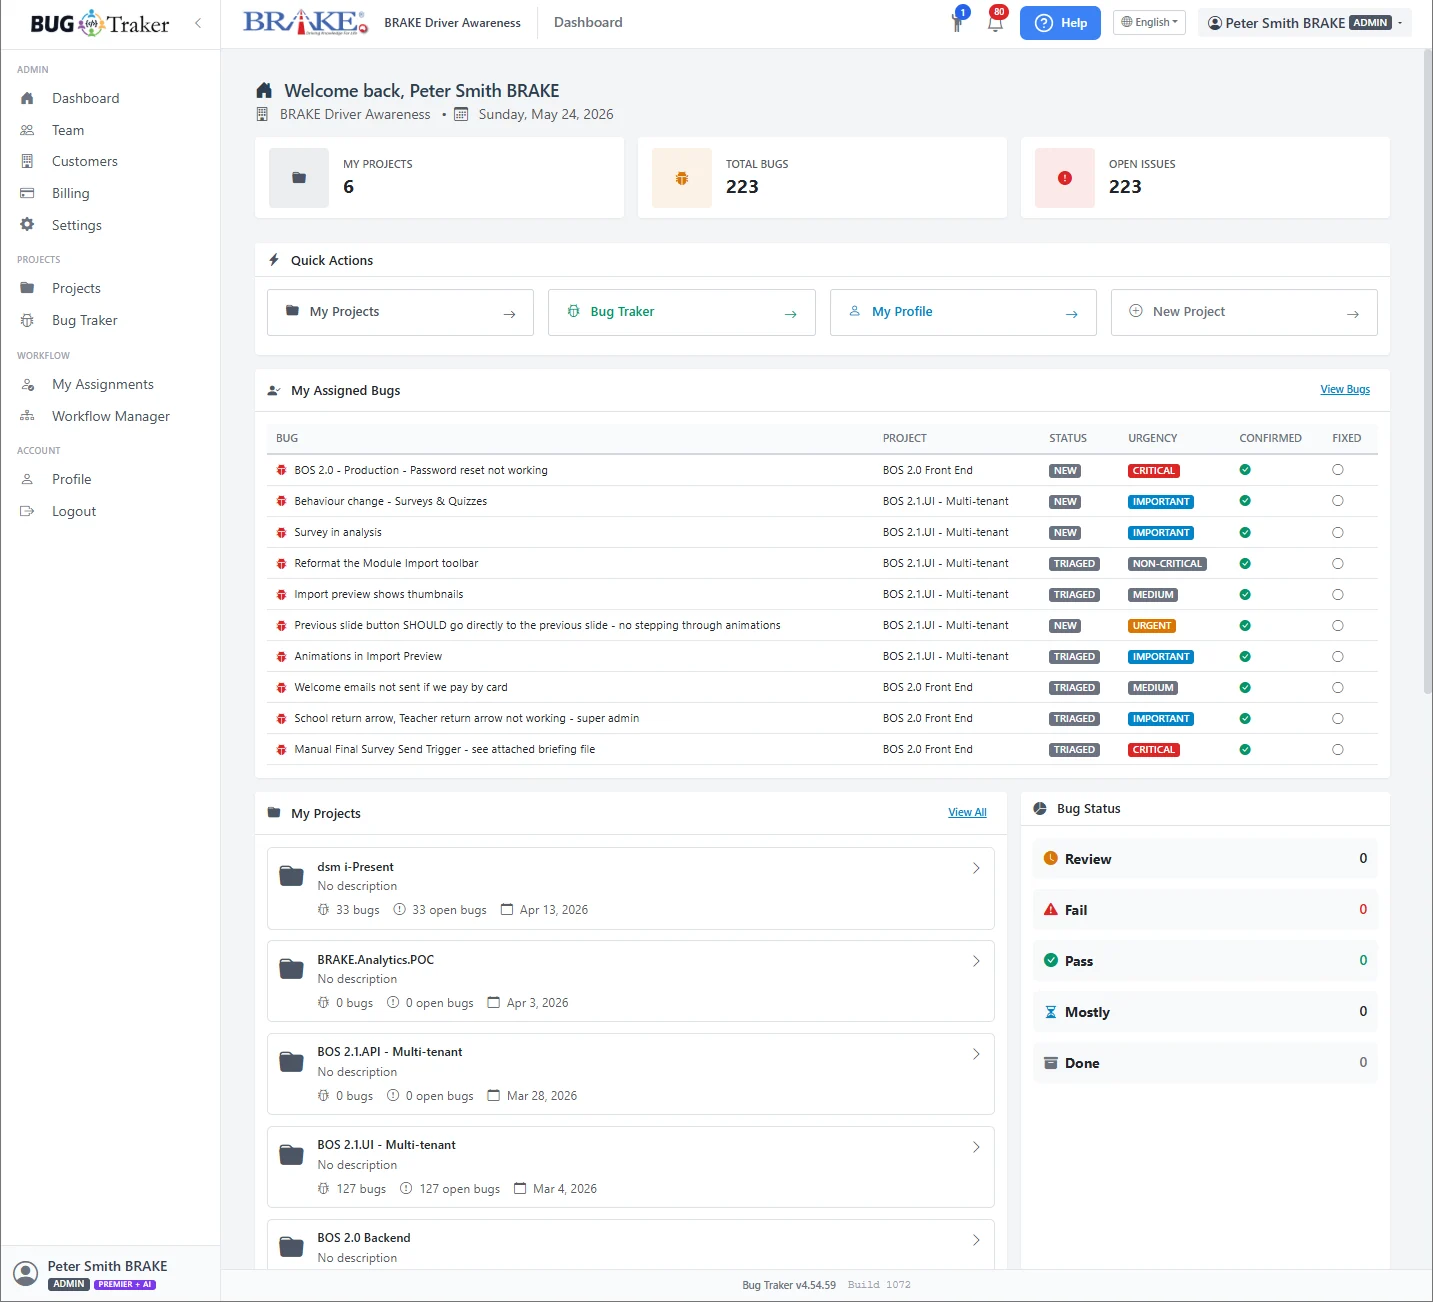
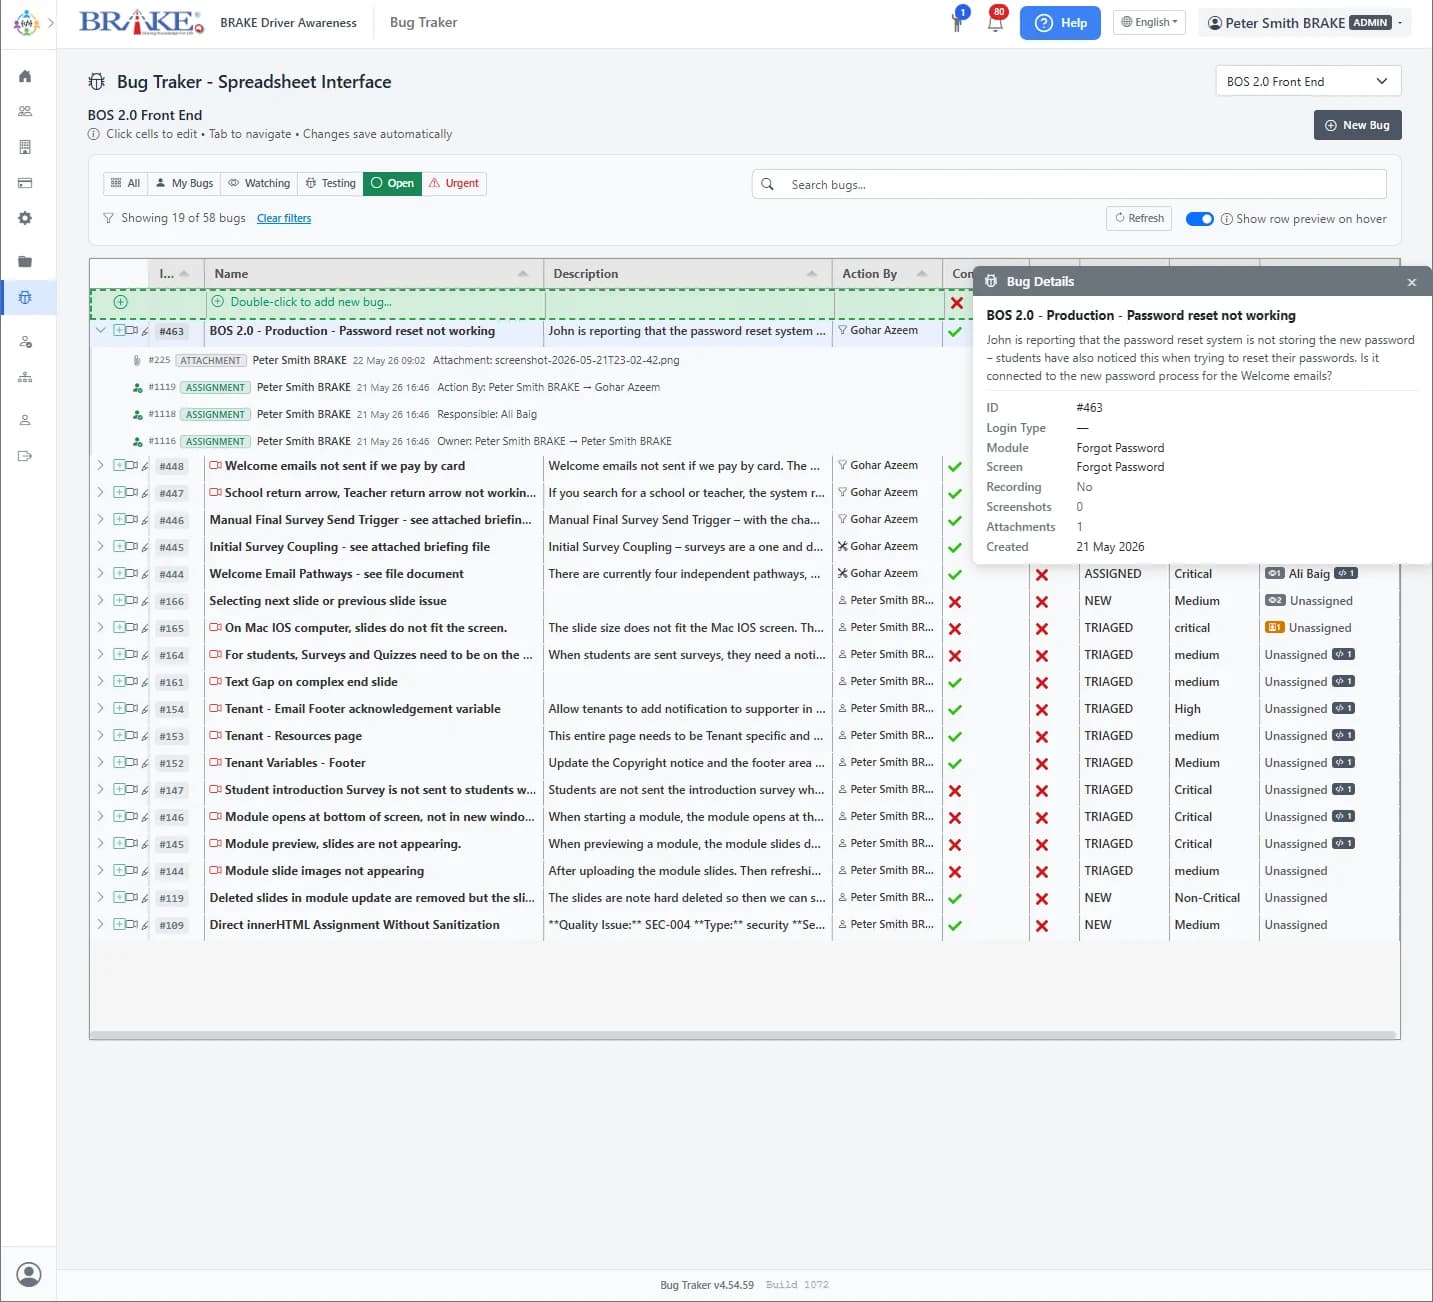
One record
Evidence, discussion, ownership and history stay together.
One lifecycle
Report, triage, fix, verify and close without losing context.
One connected system
QA, developers, customers and AI agents work from the same source.
The bug report is usually the weakest link.
Most issue trackers begin after the useful evidence has disappeared. A user reports what they remember, QA reconstructs the sequence, and developers try to reproduce it on another machine.
Bug Traker starts earlier — at the moment something goes wrong.
Something fails
The user sees the problem.
Context disappears
Logs, clicks and state are lost.
The ticket is incomplete
QA asks for more detail.
“Can’t reproduce”
The issue stalls.
See what happened — not just what someone remembers.
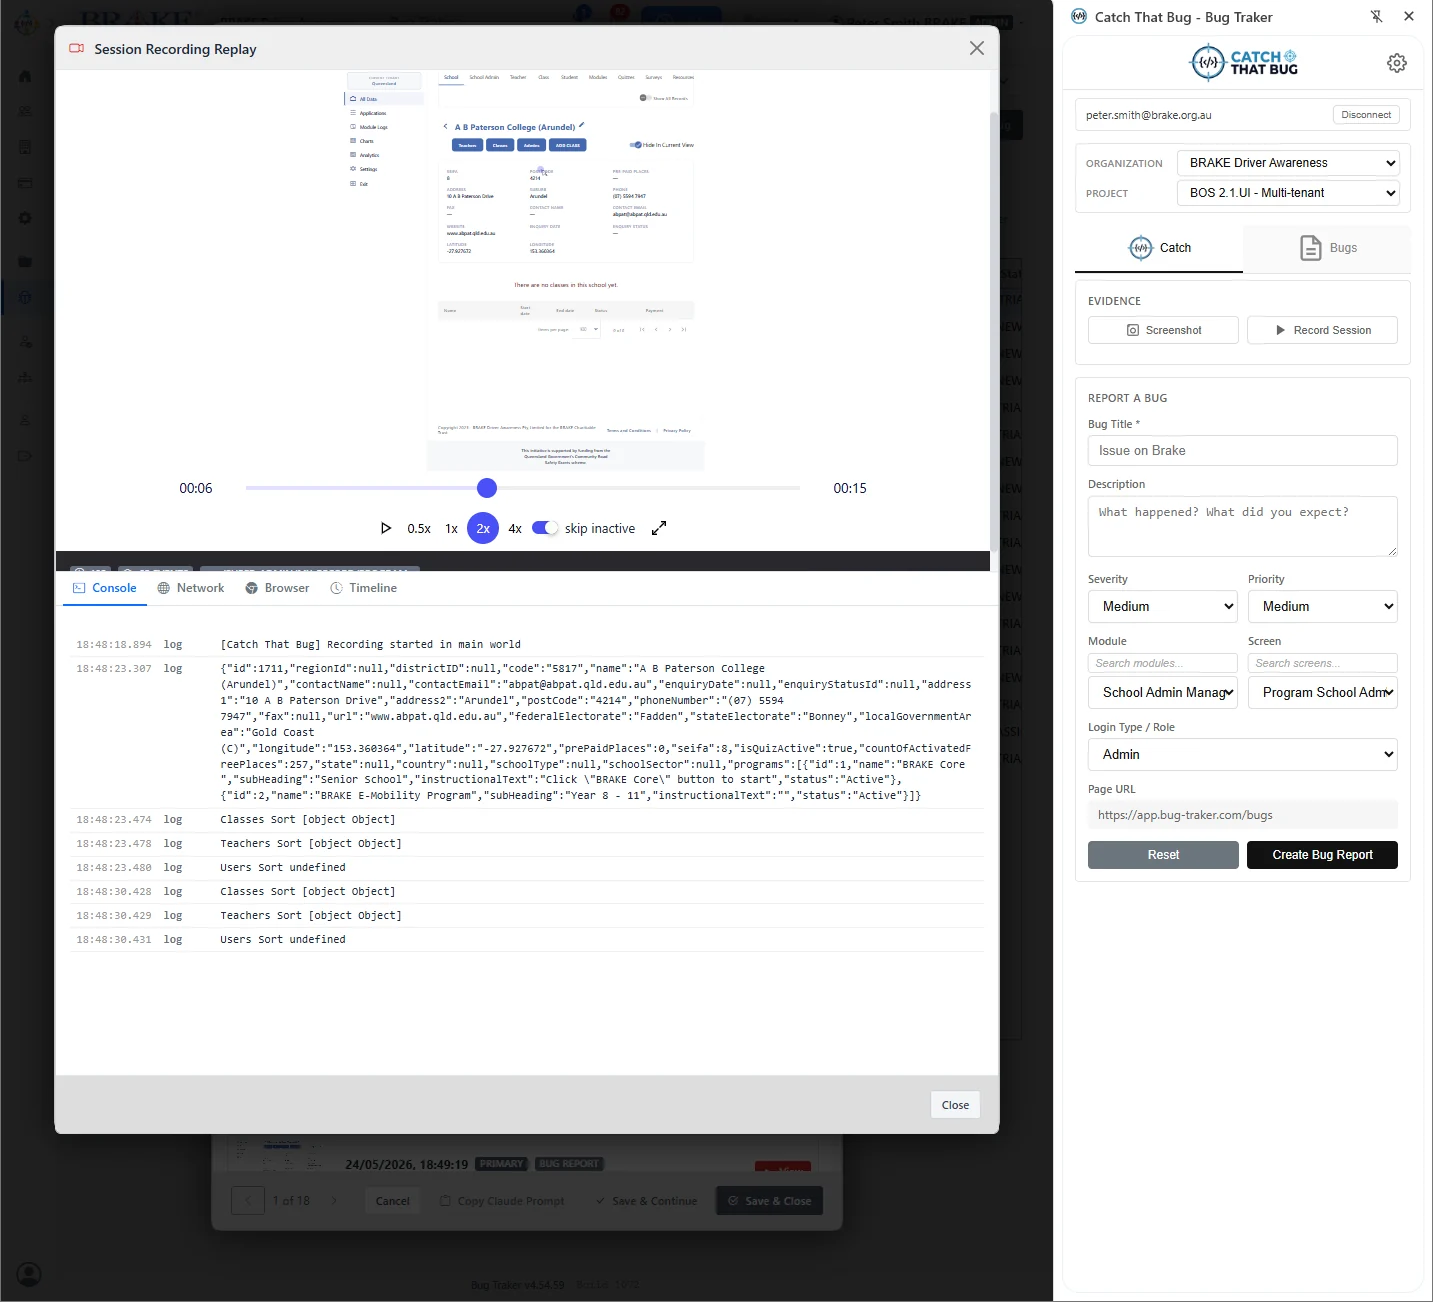
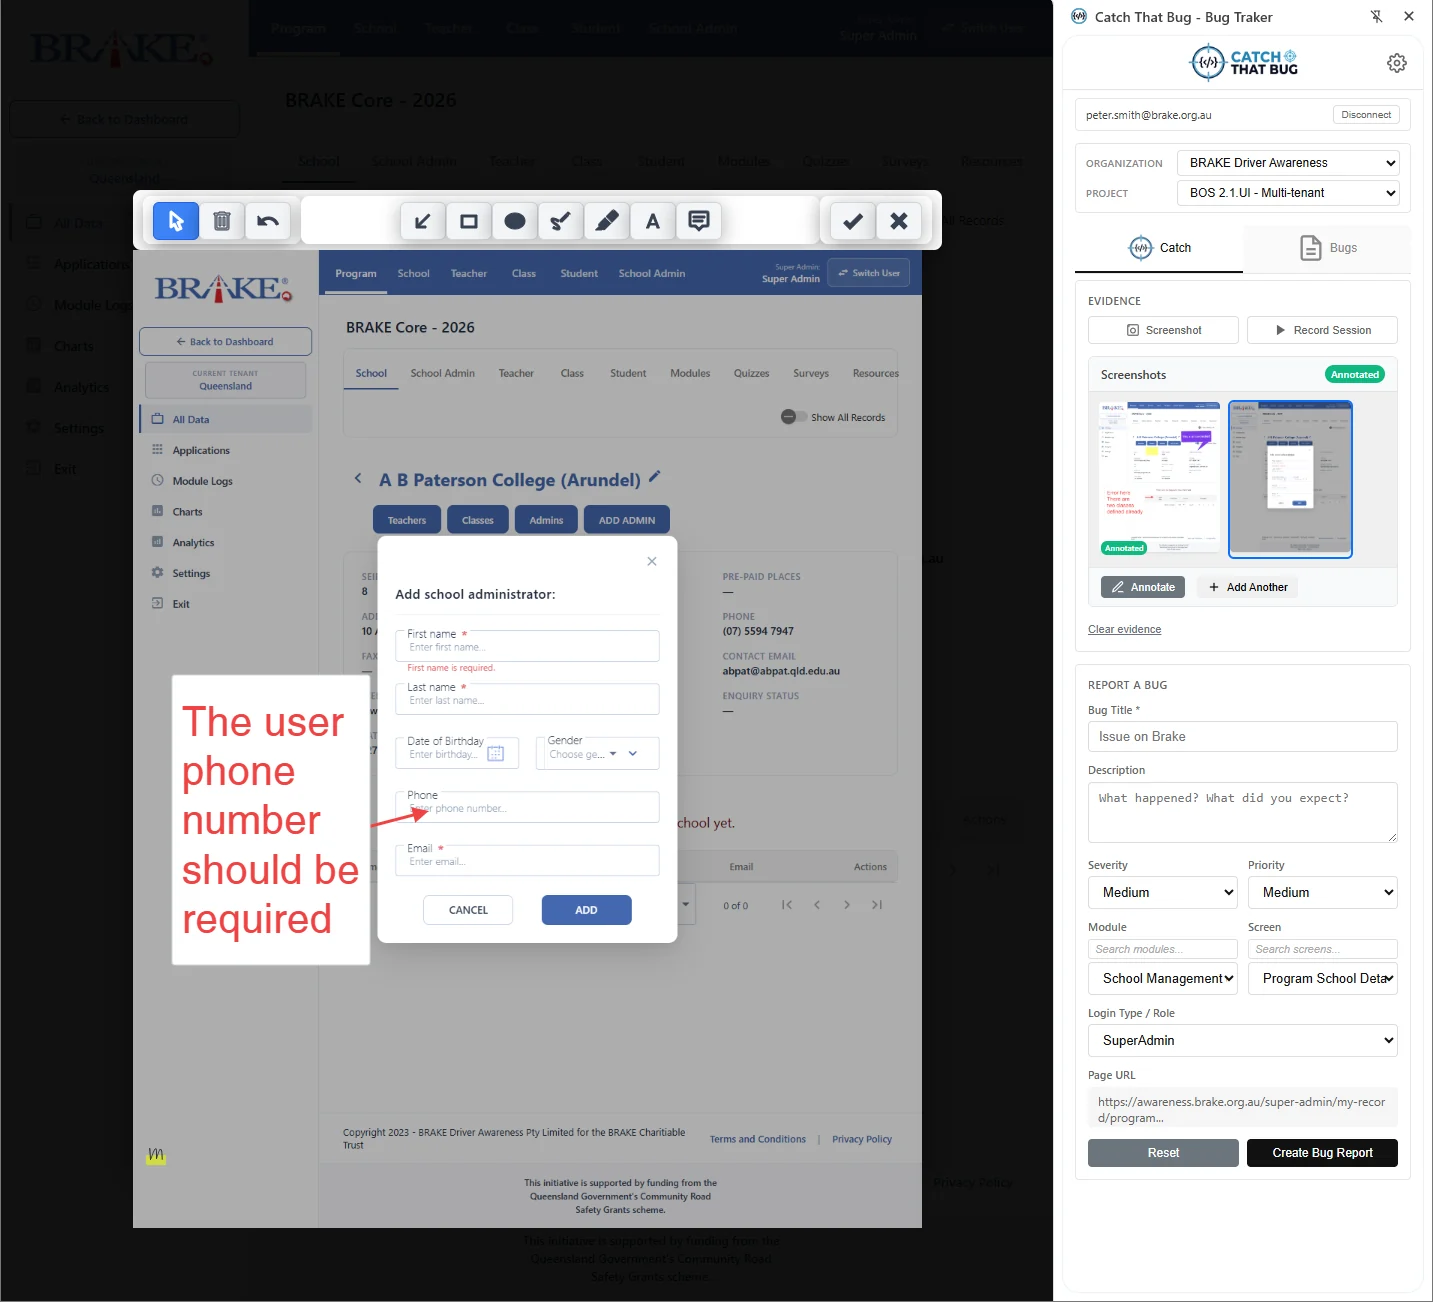
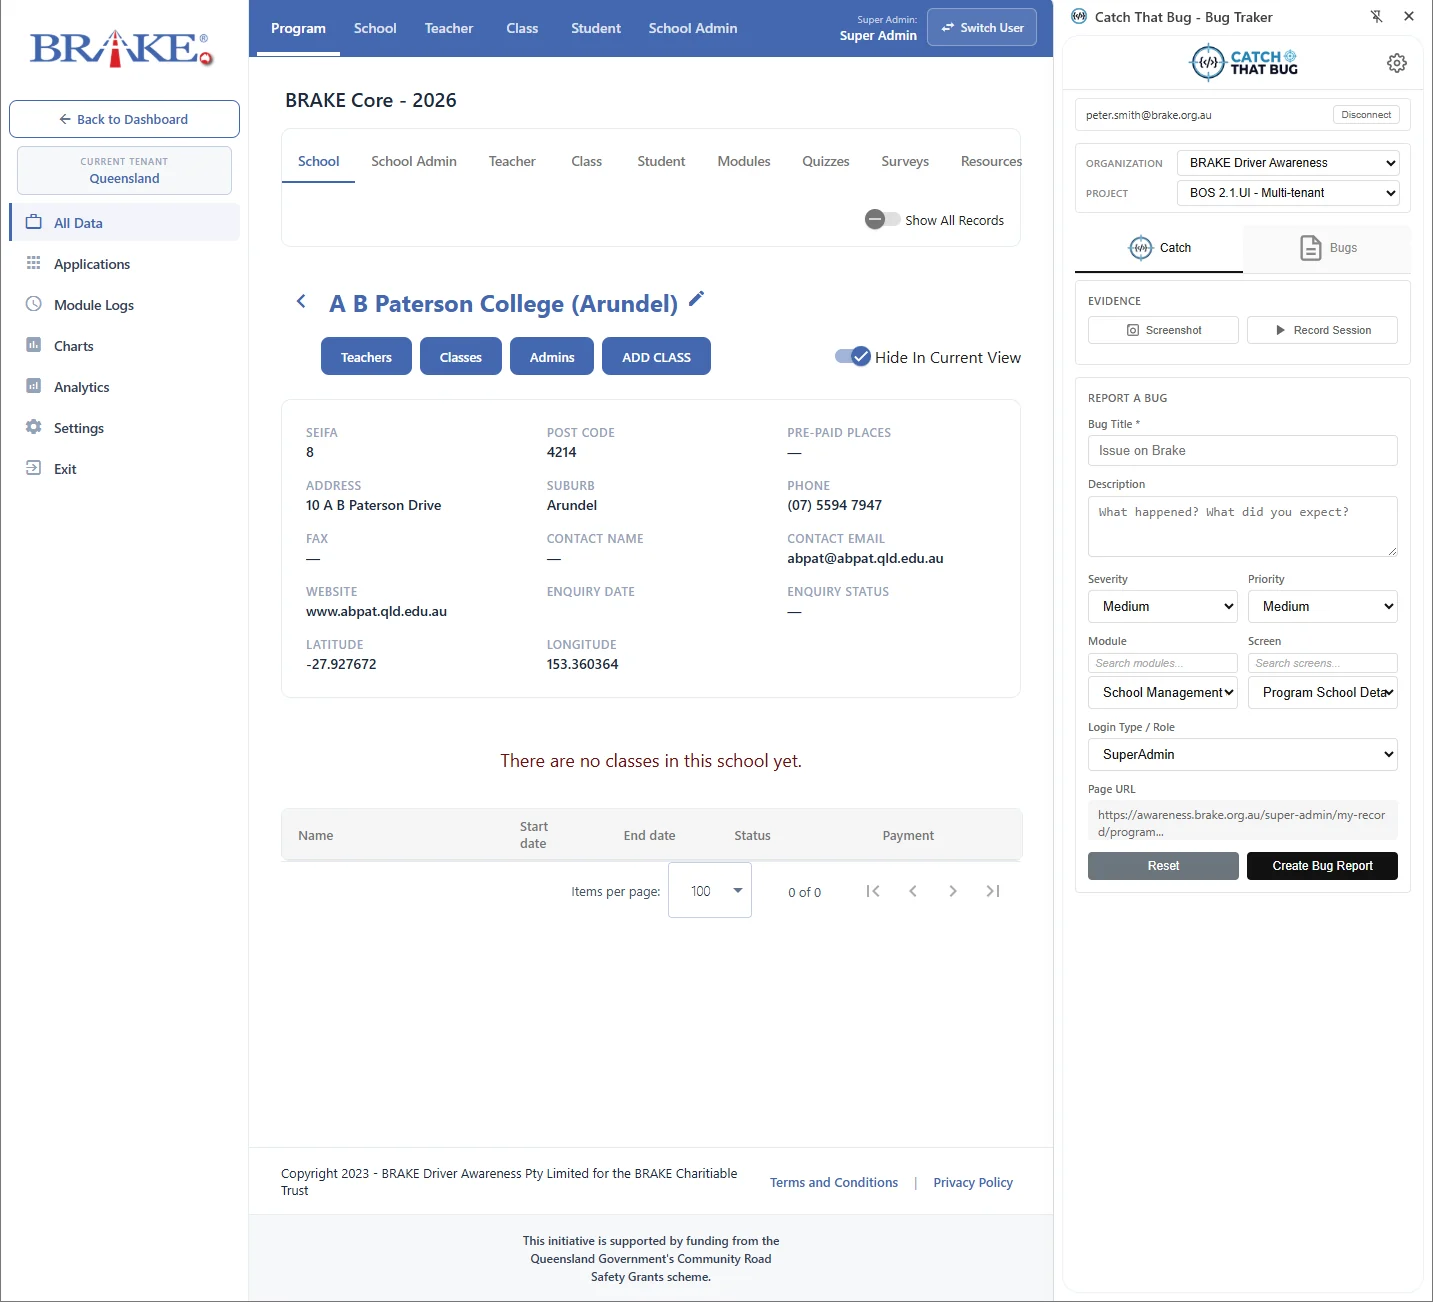
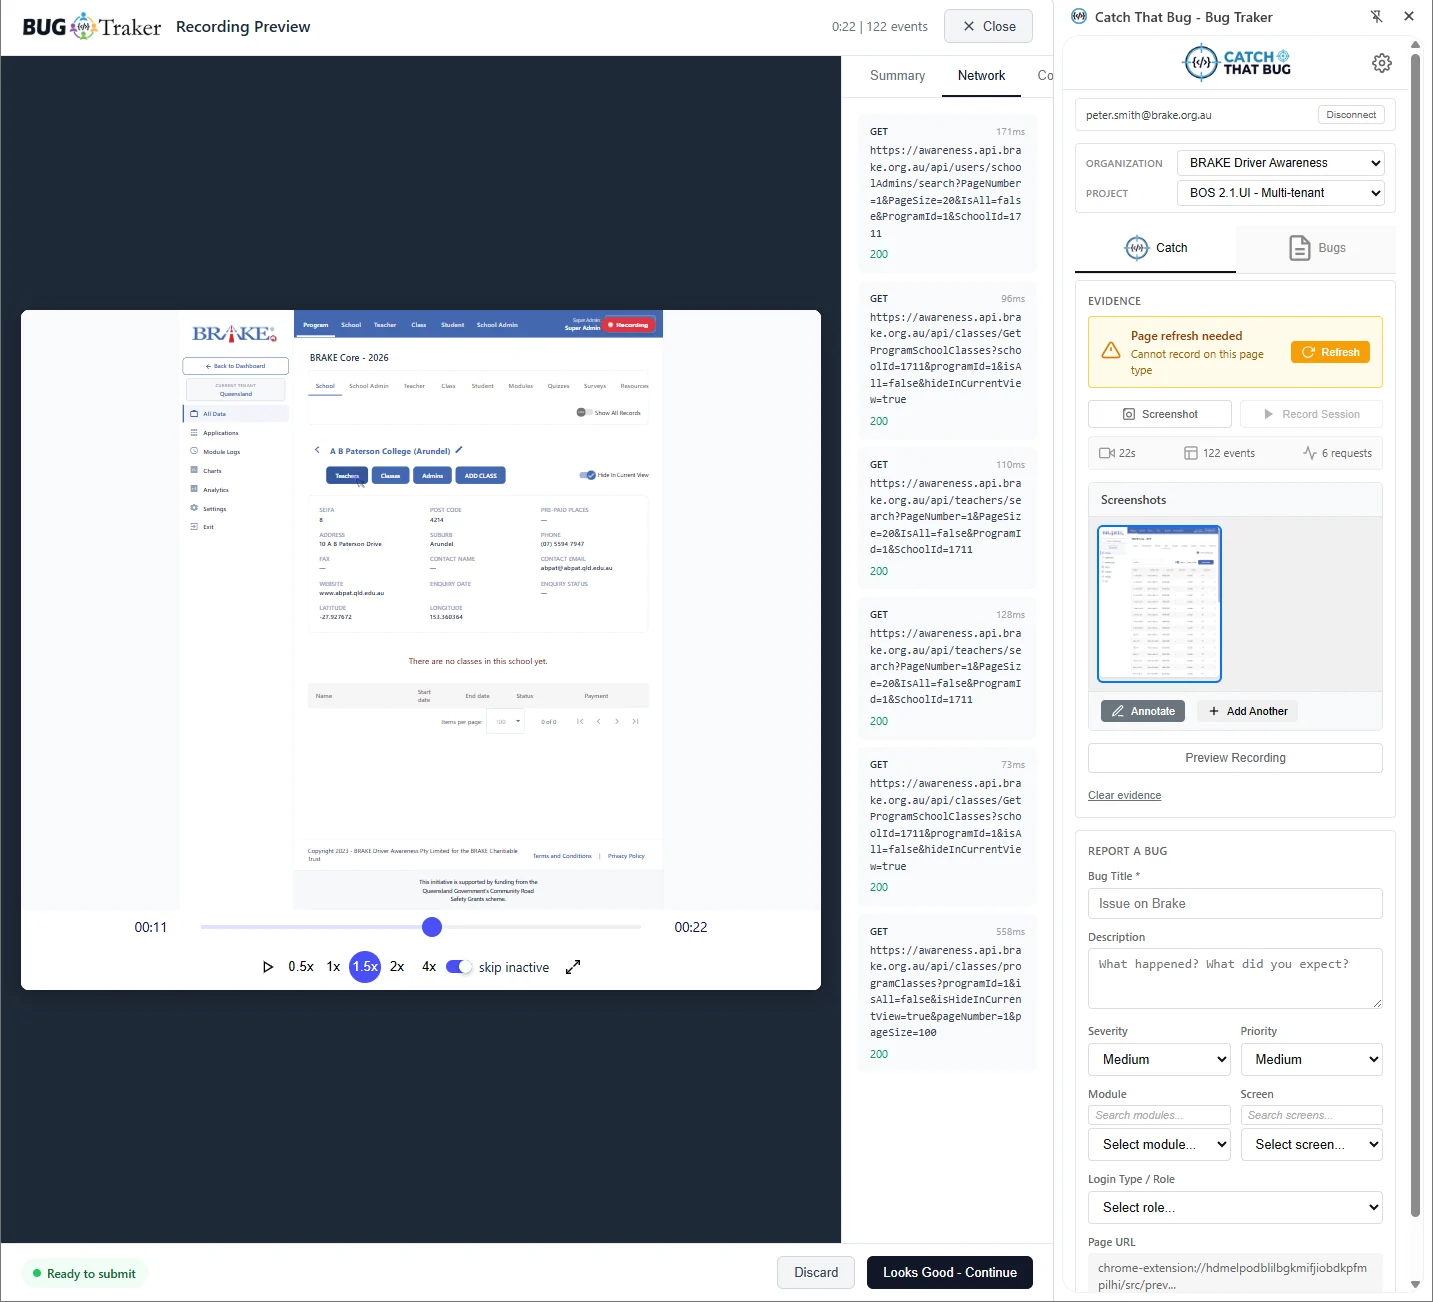
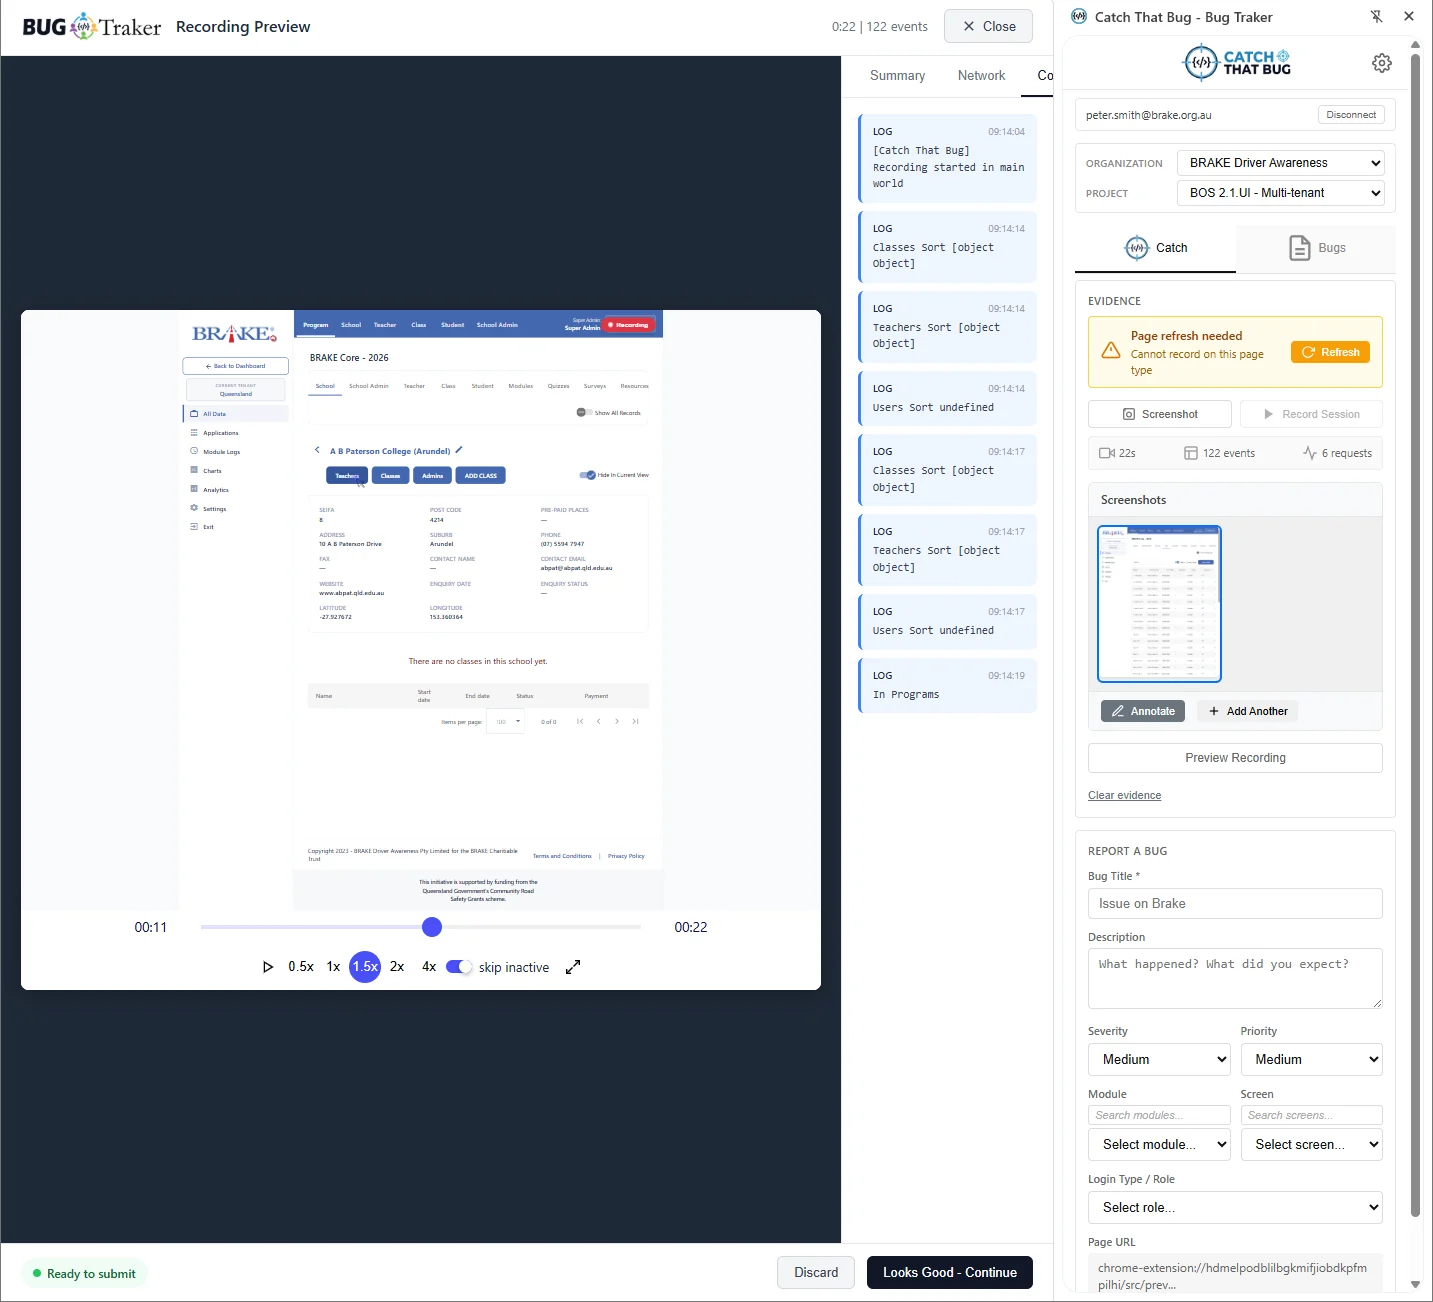
The browser extension records the evidence developers normally have to chase: a time-bounded DOM replay, console and network activity, annotated screenshots and browser context.
- Capture evidence while the failure is still on screen
- Annotate screenshots to direct attention precisely
- Replay the user journey alongside technical evidence
- Add further evidence to an existing bug when needed
“The report arrives with the context required to investigate it.”
From report to verified resolution — without losing the thread.
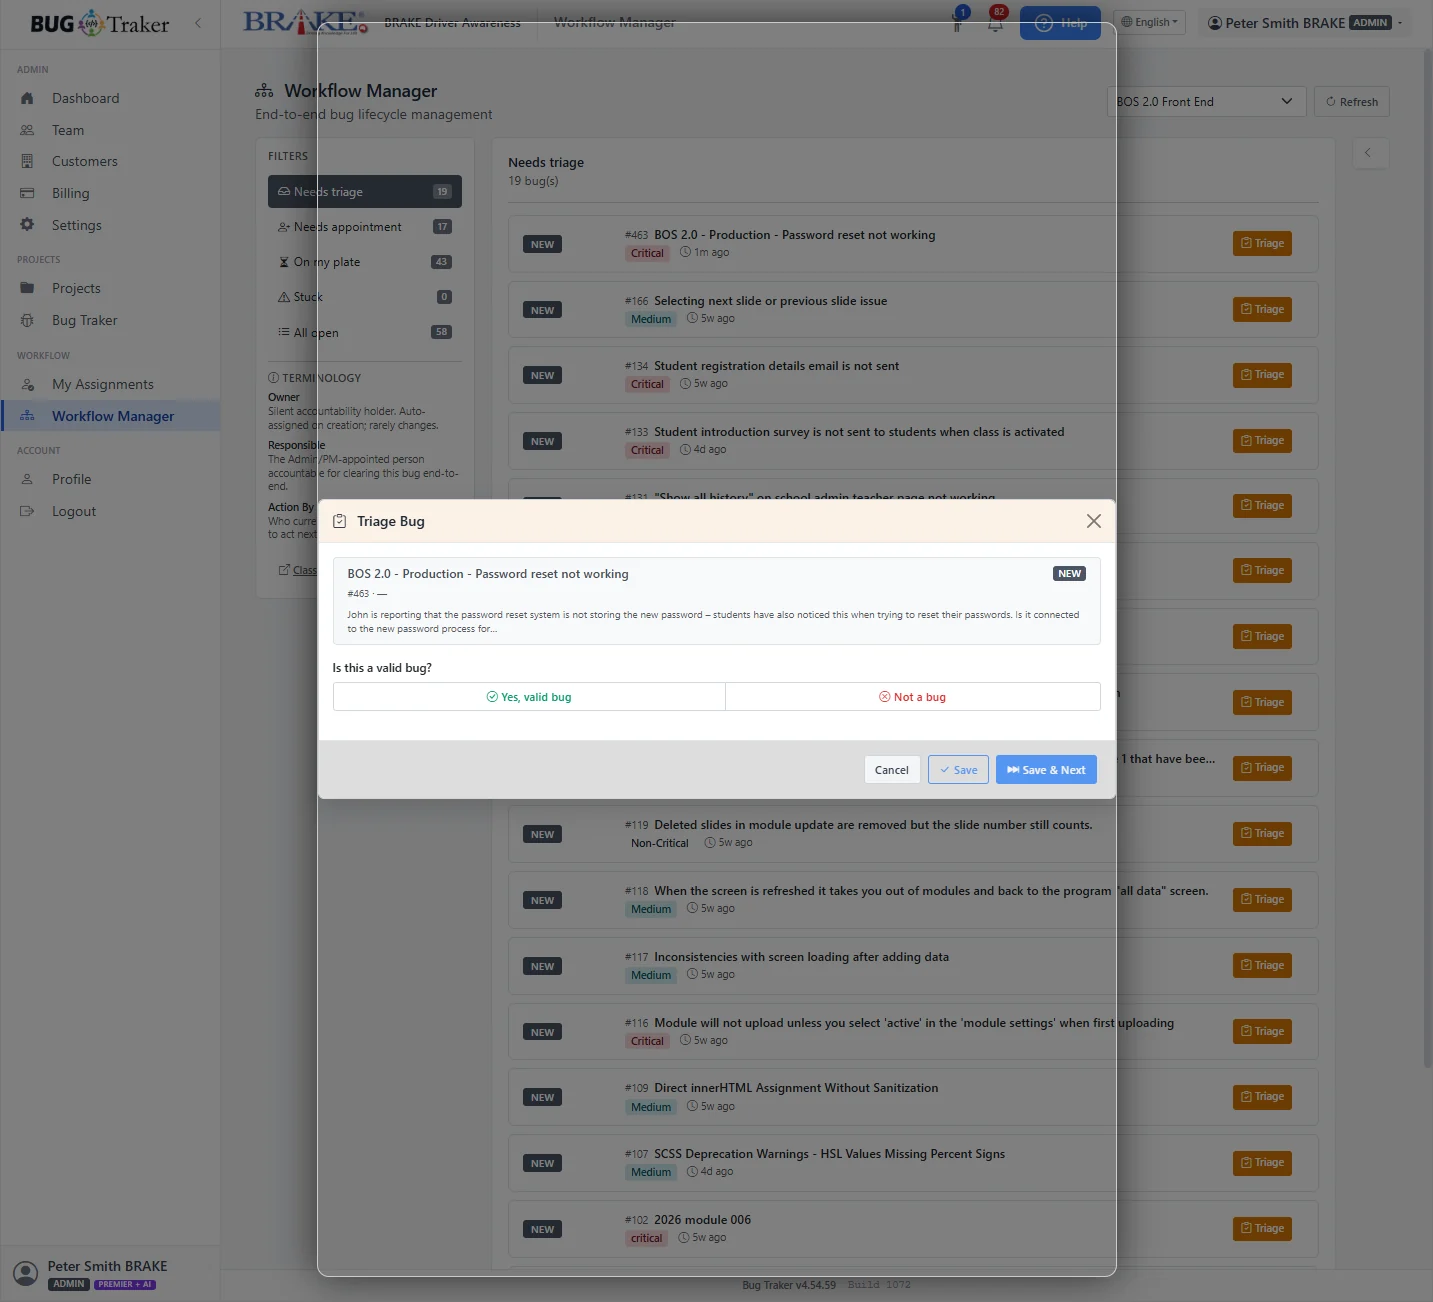
Evidence, ownership, technical work, discussion and verification stay together as the issue moves through the team.
- New
- Triaged
- Assigned
- In progress
- Resolved
- Verified
- Closed
01 / accountability
Know who owns it, who is working it and who must act next.
Real bug lifecycles are rarely represented by one assignee. Bug Traker separates the accountable owner, the person responsible for the current phase, and the person whose action is awaited.
- Owner
- Long-term accountability
- Responsible
- Current phase worker
- Action By
- The ball-in-court
02 / complete context
Open one bug and see the entire working record.
Captured evidence, reproduction information, assignments, discussion, developer notes, verification guidance and immutable history all remain attached to the bug.
View the full interface tour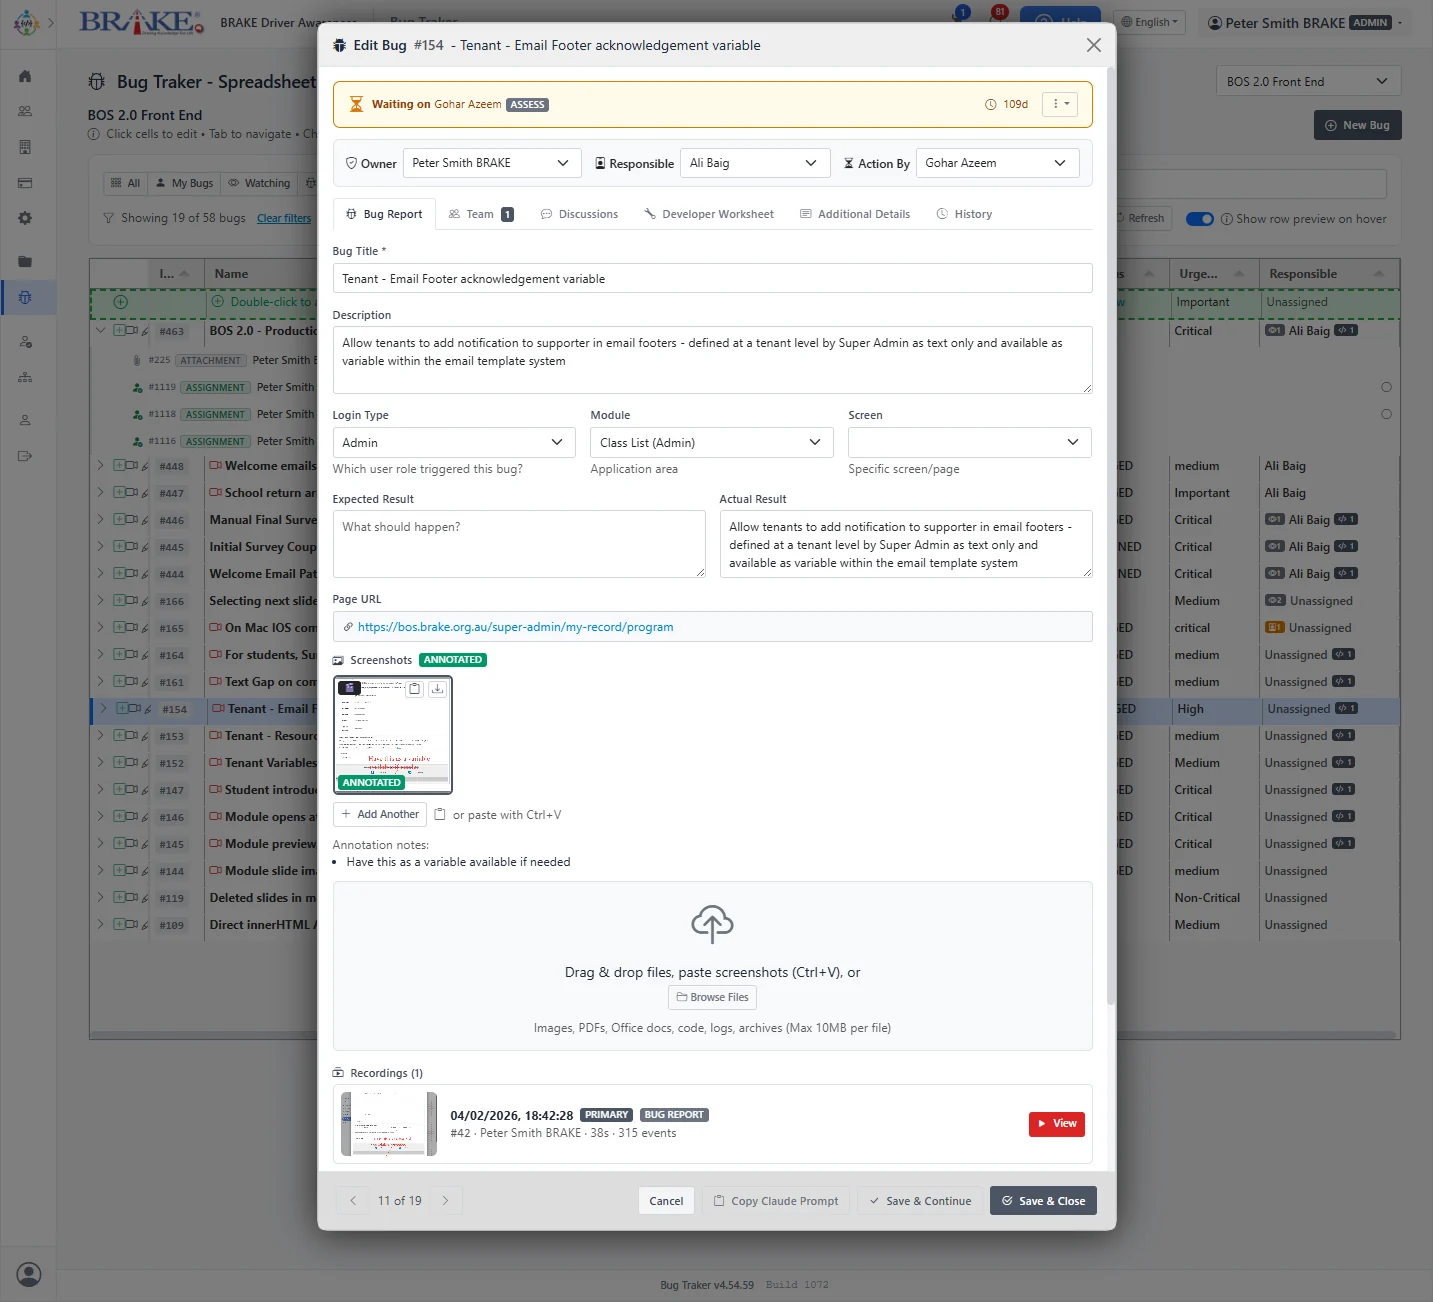
Work the bug where the code is.
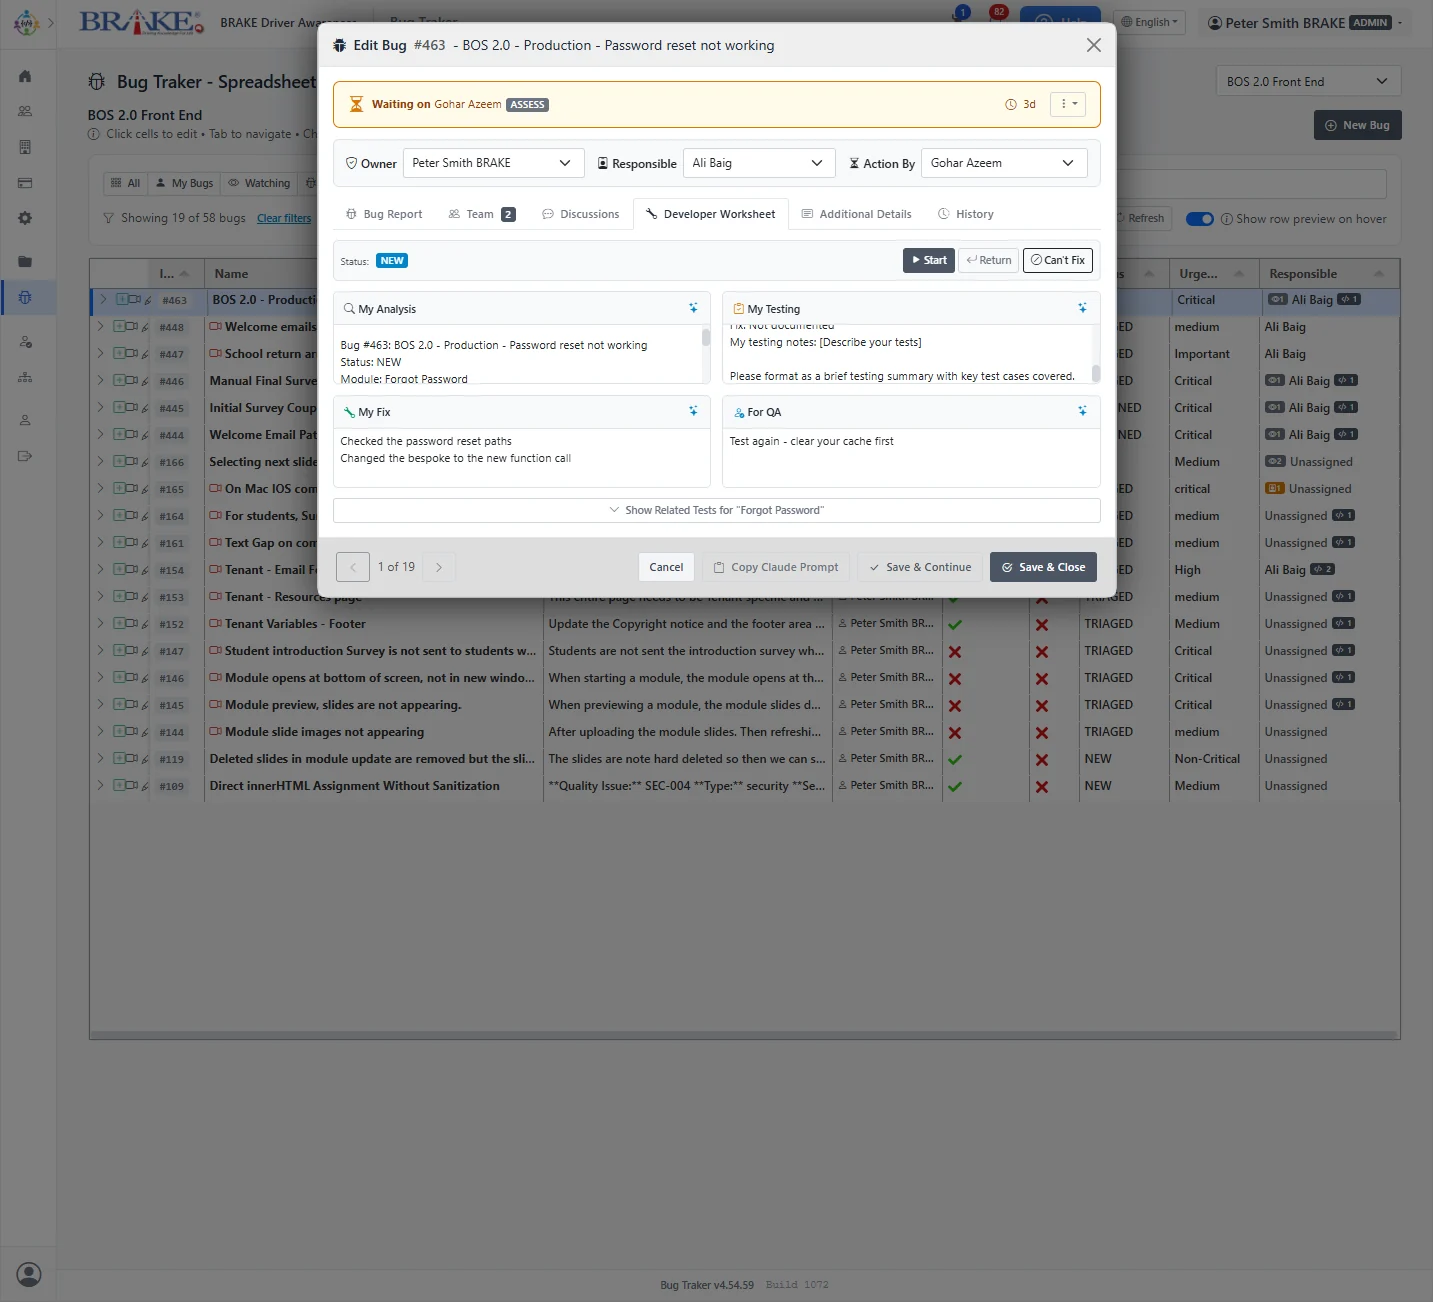
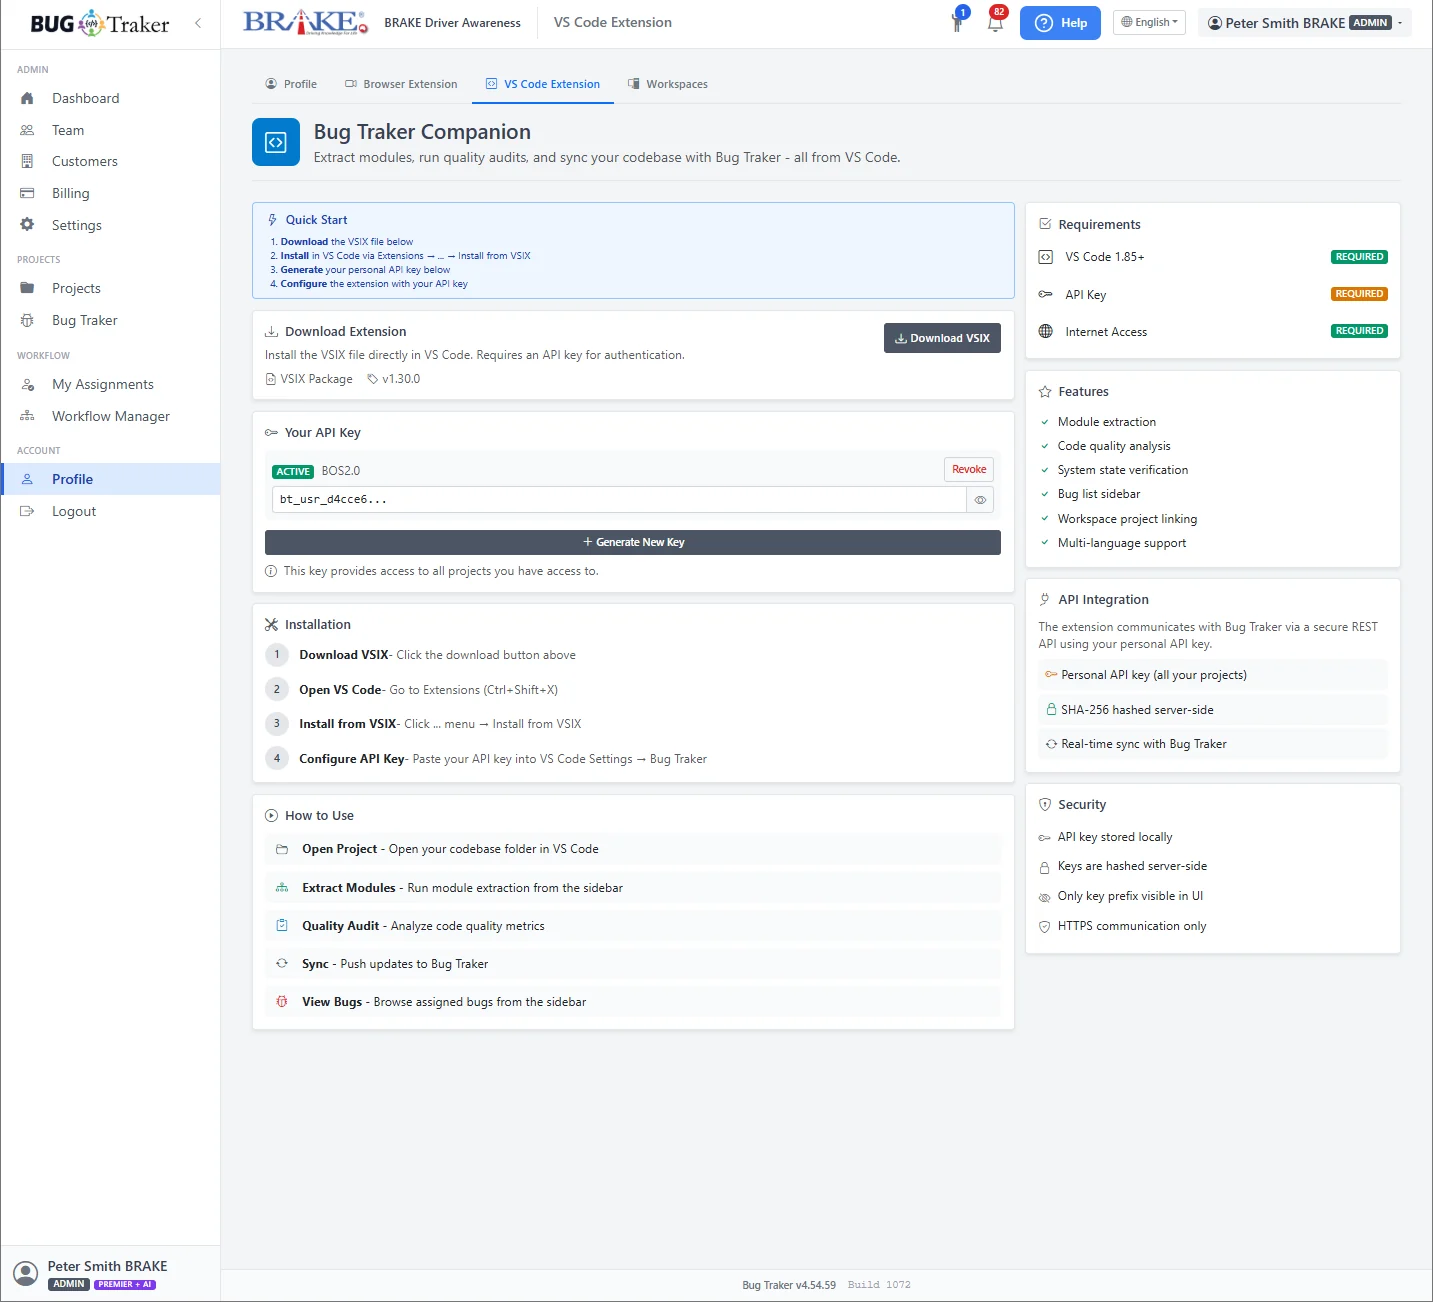
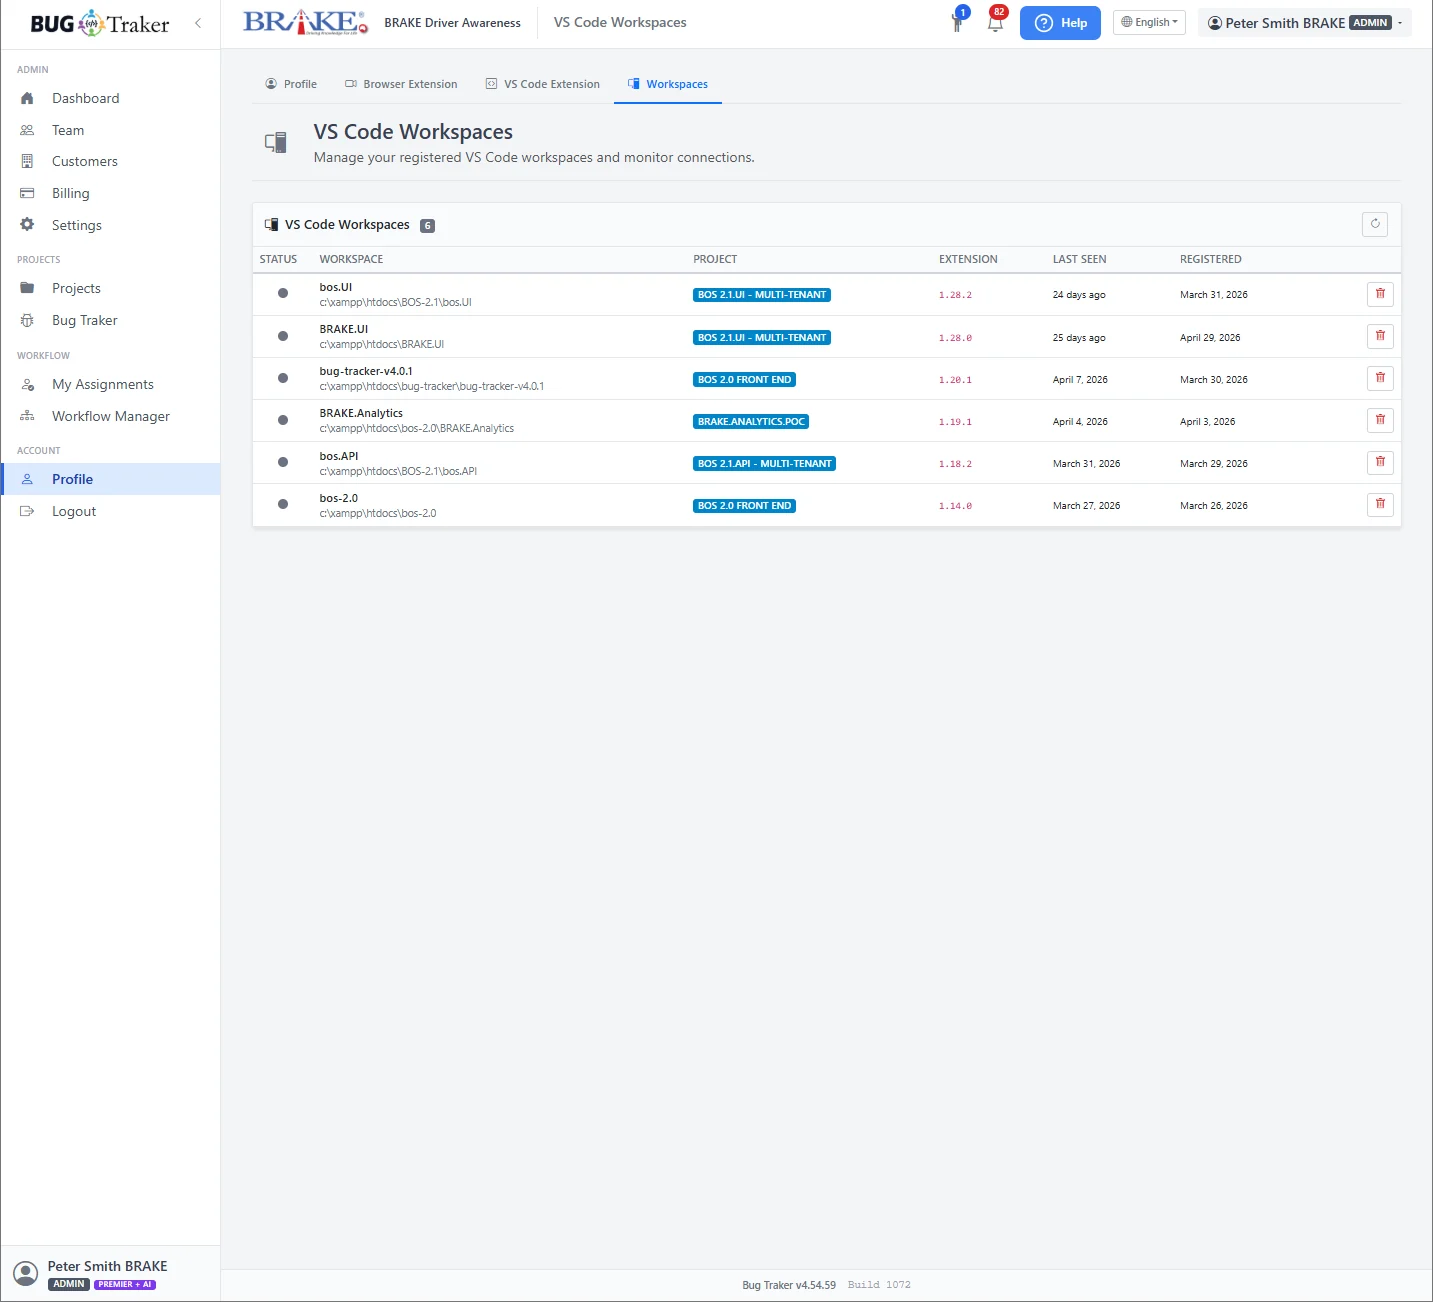
The Bug Traker Companion surfaces bugs inside VS Code. Its MCP server gives compatible AI agents structured access to bug context, and a controlled route for submitting extracted modules, tests, quality findings and system-state information.
- VS Code companion
- Claude Code
- MCP server
- OpenAPI
Developers can investigate, update and document the work without reducing the bug to a copied prompt or a disconnected chat.
Architecture intelligence
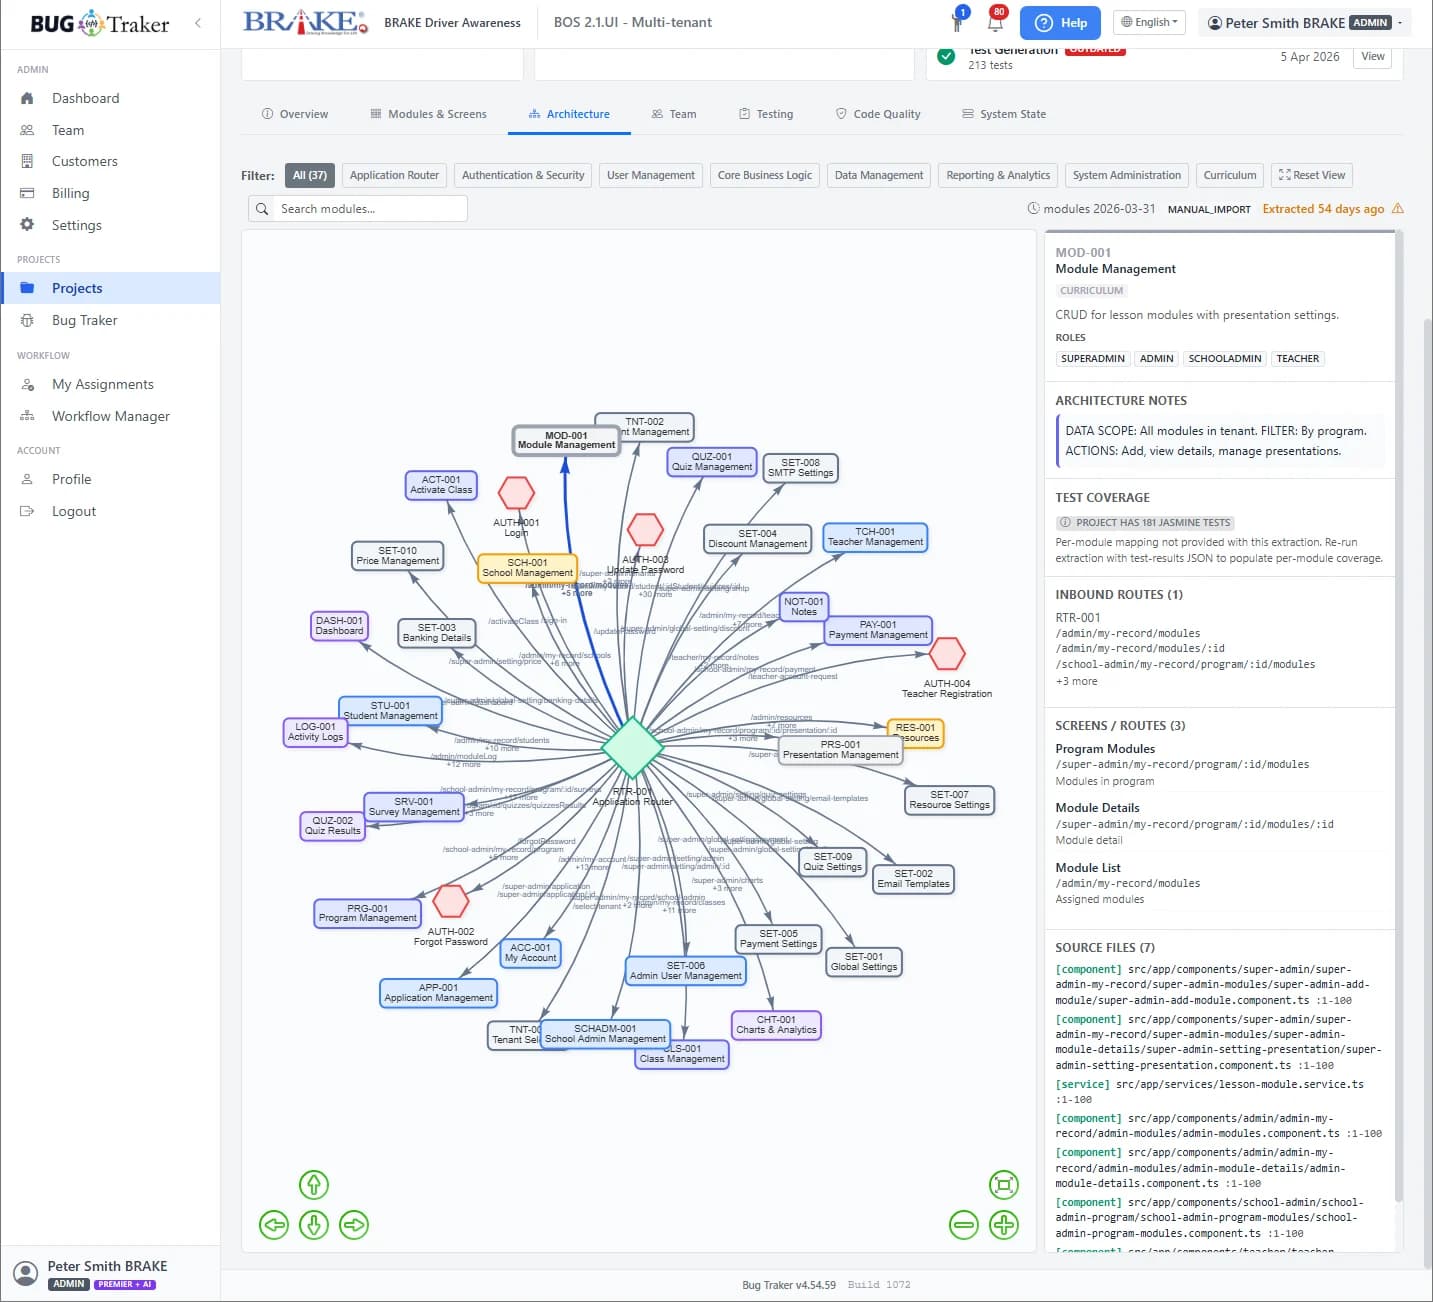
Map the codebase into modules and screens.
AI-assisted extraction creates a reviewed architecture map connected to the same modules used by bugs and tests.
Code quality
Connect findings to the product structure.
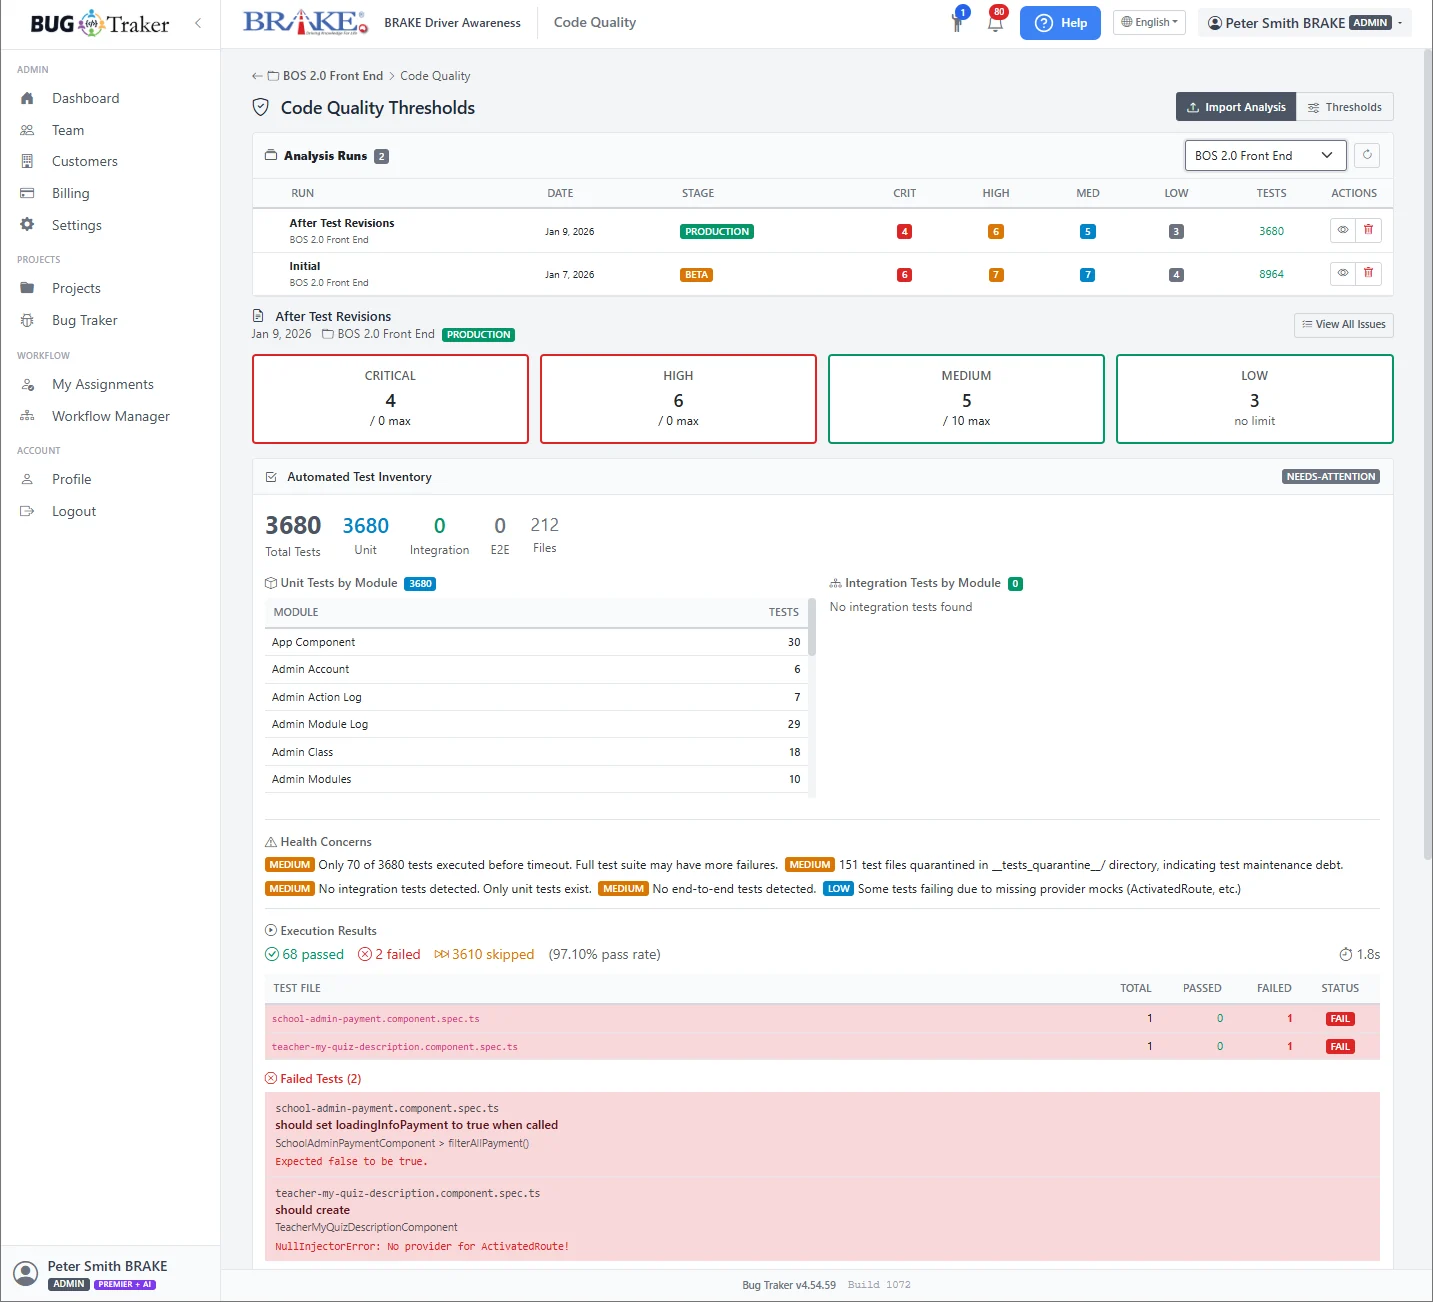
Quality analysis identifies security, performance, bug and maintainability findings at module level.
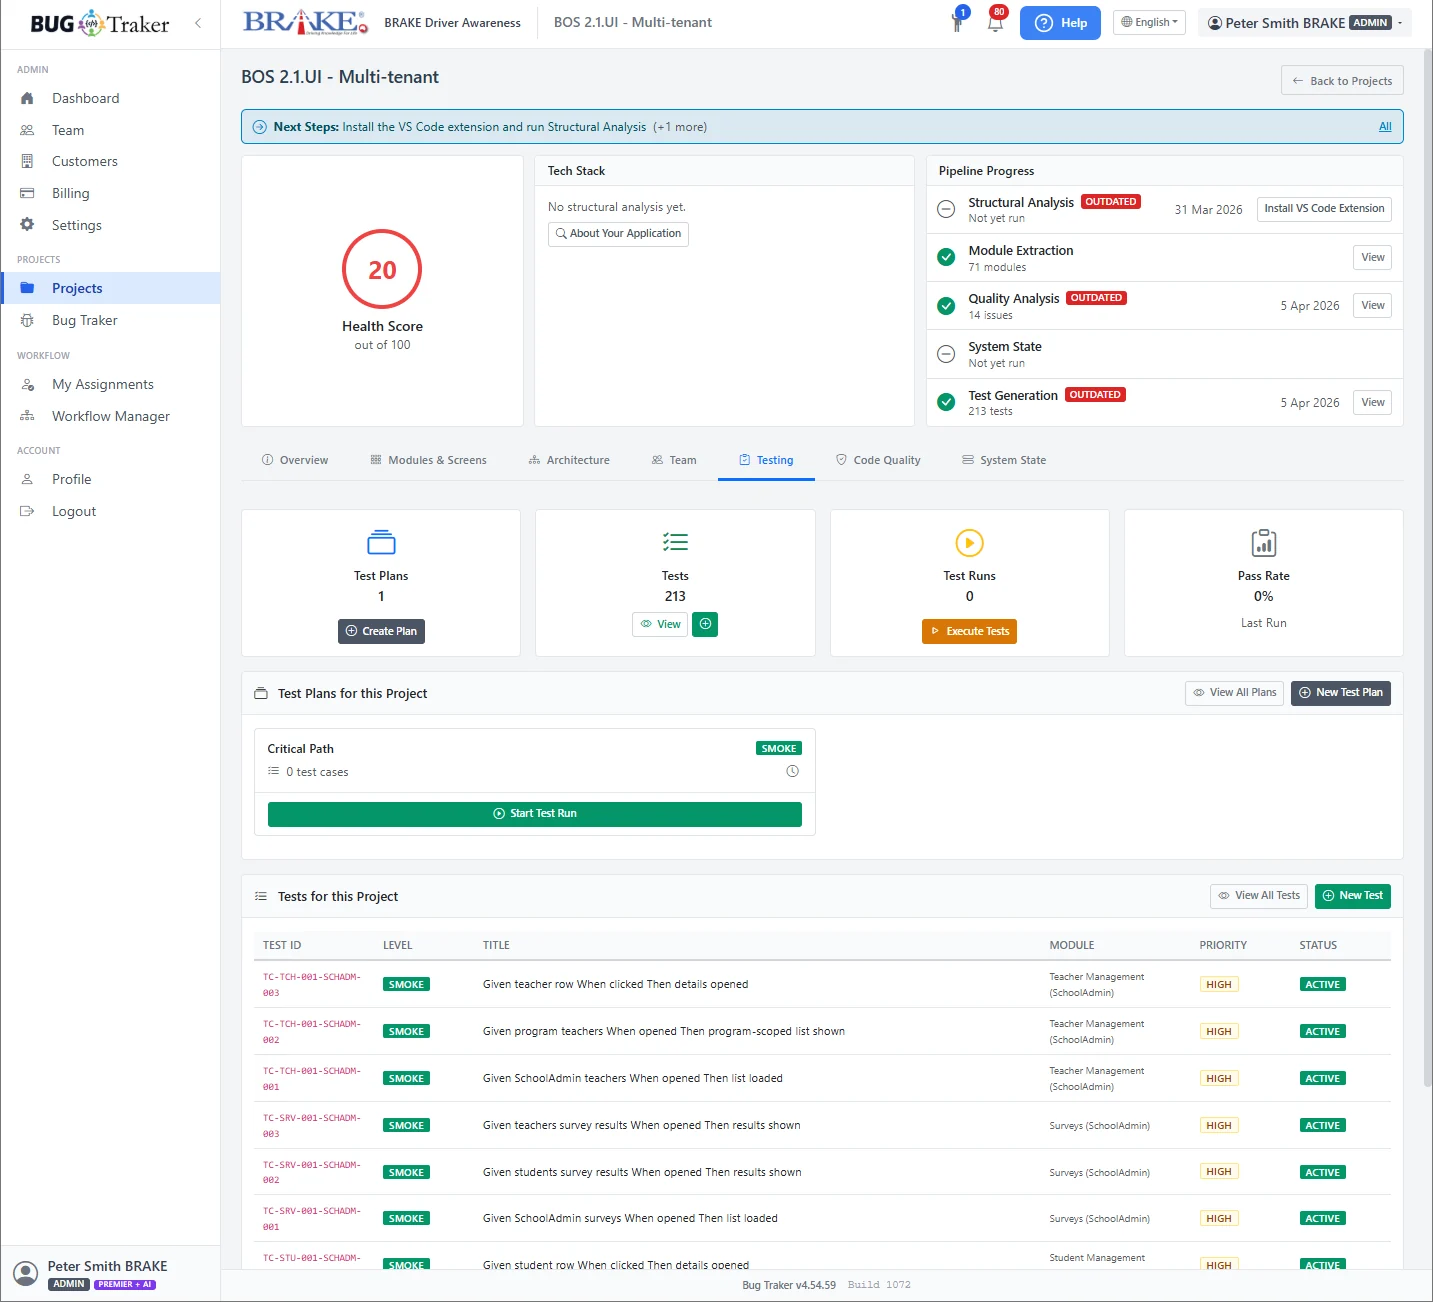
Plan, run and record verification in the same system as the bug.
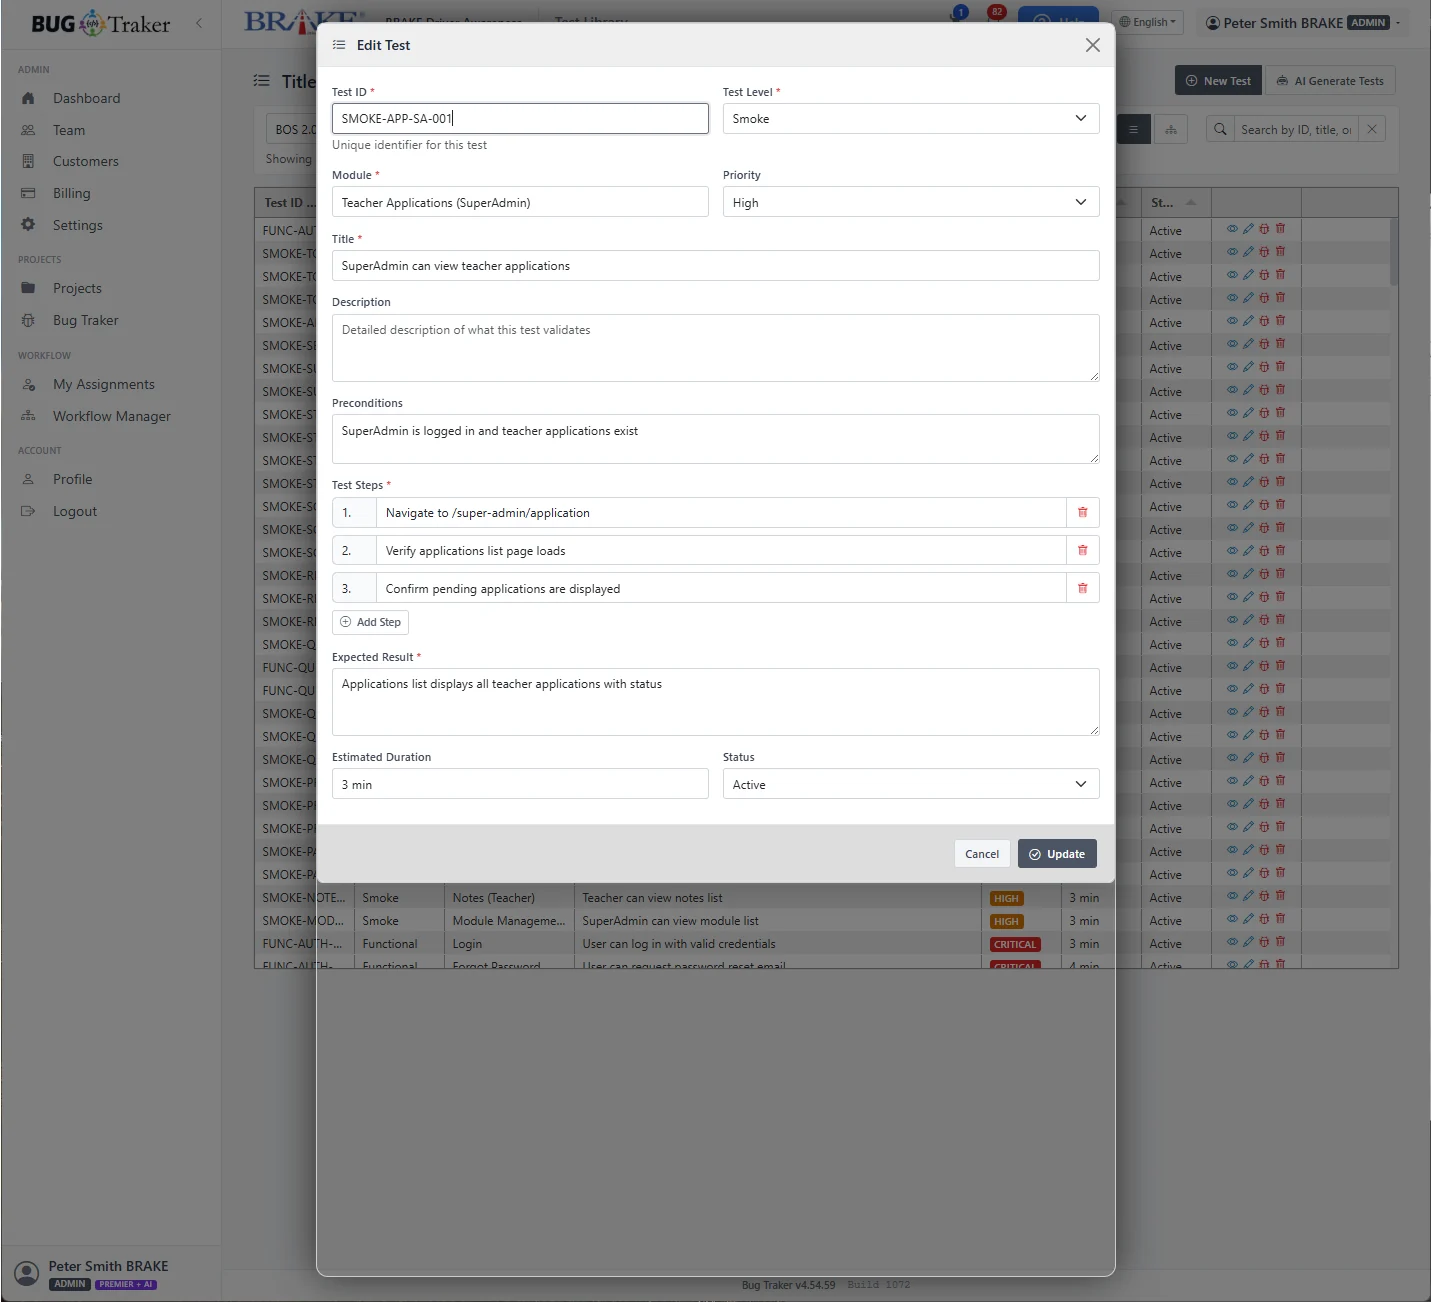
Reusable test cases are organised into plans, executed in runs and linked back to the bugs they failed against. AI-generated test definitions can be imported, reviewed and managed as normal product records.
Define
Reusable test cases and structured steps.
Organise
Build plans around releases, modules or risks.
Execute
Record pass, fail or skip with evidence.
Verify
Link failed tests directly to bugs.
Built for the people involved in the whole bug lifecycle.
QA managers and testers
Triage, workflow, test execution, verification and quality reporting.
Developers and AI agents
Complete context in VS Code, controlled updates and structured technical records.
Project and product leaders
Clear accountability, workload, history and closure controls.
Customers and reporters
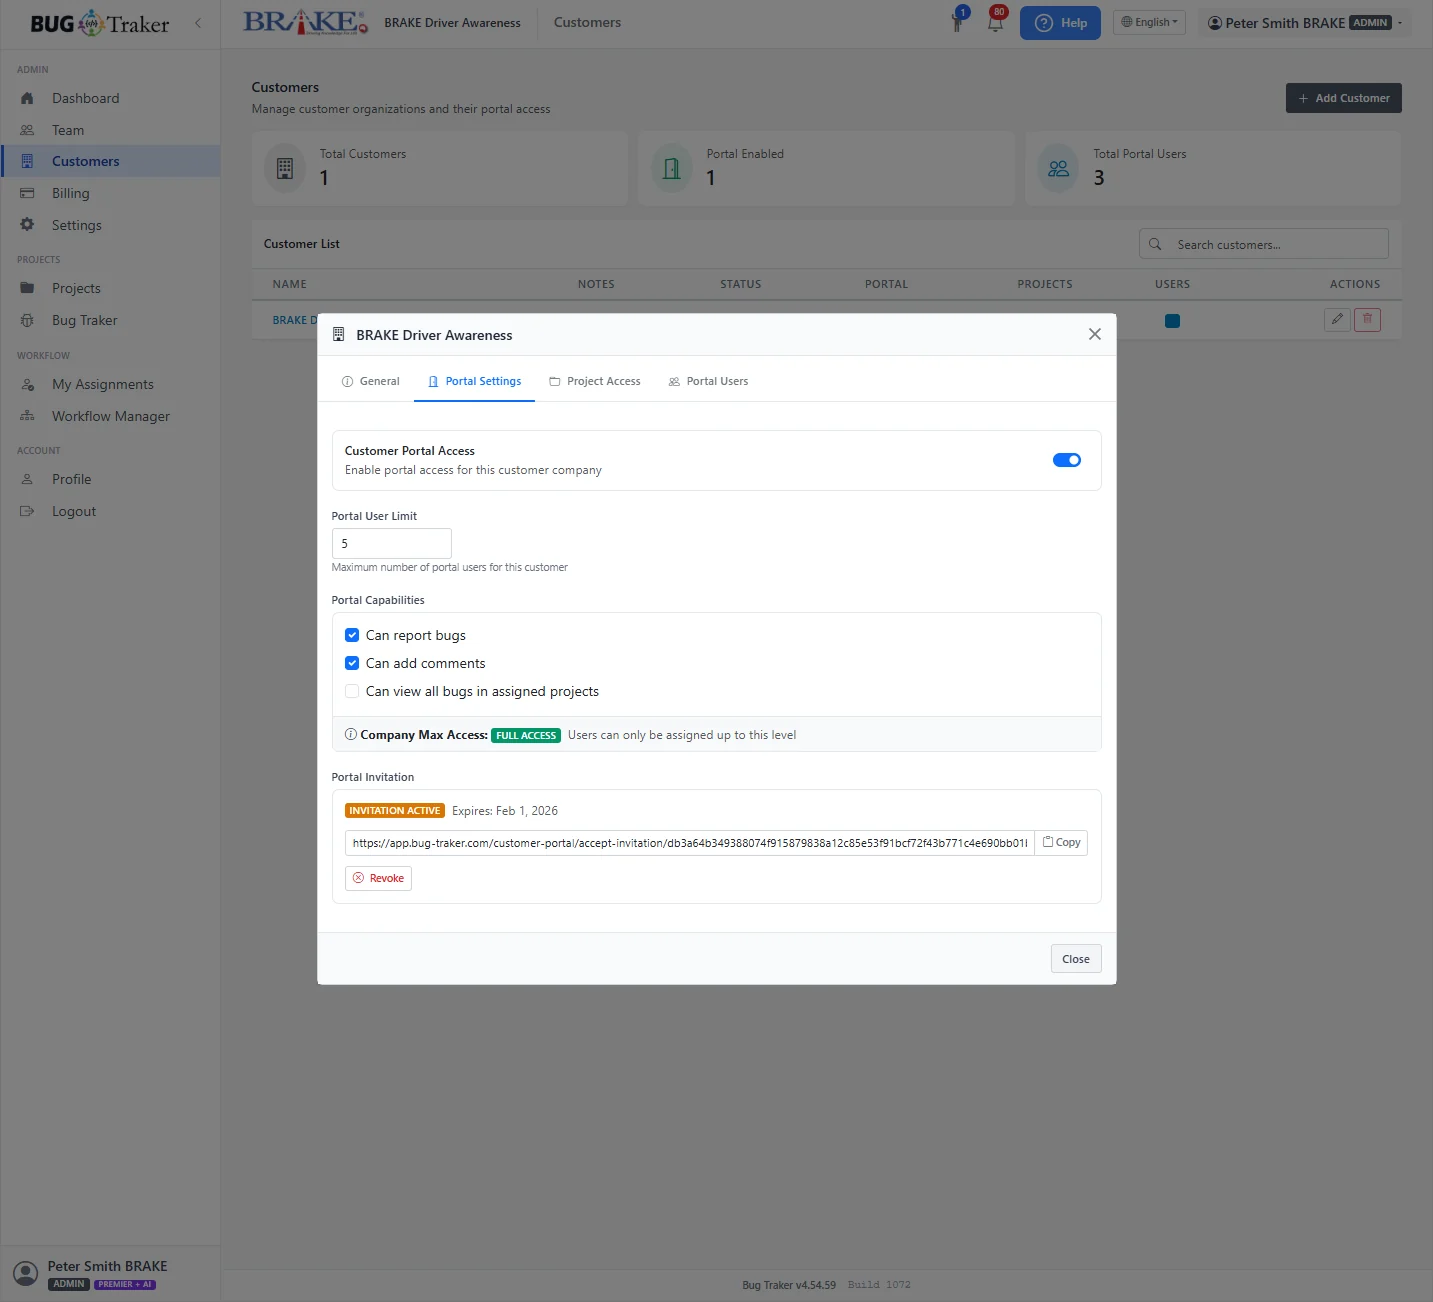
A separate project-scoped portal for reporting, commenting and status visibility.
The controls expected by growing software teams.
Strict tenant isolation
Multi-tenant data boundaries enforced throughout the platform.
Immutable audit history
Lifecycle and administrative actions remain attributable.
Customer portal
External users work through a separate project-scoped surface.
Documented API
An OpenAPI contract supports controlled integrations.
International interface
Production-ready localisation for global teams.
Reviewed AI output
Extraction snapshots require explicit review and activation.
start with a real project
Replace the disconnected bug-tool stack with one disciplined lifecycle.
Capture better evidence. Give developers the full context. Connect testing, quality and AI-assisted development to the issue that started the work.
- No card required
- Two users included
- One live project
Accounts, paid plans and the interface tour are handled on bug-traker.com. Questions about fitting it to your team? Talk to us.
Our other platforms
ArtFlow Pro
Art & galleries
Artwork inventory, consignment and marketing documentation that connects independent artists with the galleries that sell their work.
ExploreiLearn Today
Tutoring
An online tutoring platform linking qualified teachers with students for individual and small-group sessions.
ExploreMember Manager
Clubs & community
A WordPress plugin for volunteer and member administration — joining, renewals, skills, sponsors and reporting in one place.
ExploreInsite Learning
Corporate training
Manage training resources, trainers, classes, students, testing and accreditation for presenter-led programmes.
Explore